Showing posts with label spectra measurement. Show all posts

Thursday, 3 August 2017

How Stack Machines Meet the Needs of Various Systems

temperature data logger
There are various characteristics which need to be met in order for these machines to be suitable and to be fully and successfully implemented into real time systems. These characteristics are as follows: size and weight, power and cooling, operating environment, cost and performance.

Size and Weight 

It has been observed that stack computers are very simple in regards to processor complexity. However, it is the overall system complexity that determines overall system size and weight. The solution to overcoming the size and weight issue is to keep component count small. That is why stack machines are less complex than other machines and are also more reliable.

Power and Cooling

If the processor is complex, it can affect the amount of power it needs. That amount of power is related to how many transistors there are in a processor and how many pins are on the processor chip. Moreover, processors that need a lot of power-consuming high-speed memory devices can also be burdensome regarding power. Of course, power consumption directly affects cooling requirements, since all power used by a computer is eventually transmuted into heat. The cooler operation of processor components can reduce the number of component failures, thus improving reliability.

Operating Environment

Embedded processing systems are well known for extreme operating conditions. The processing system must deal with heat and cold, vibration, shock, and even radiation. Also, in remotely installed applications, the system must be able to survive without field service technicians to make repairs. The general rule to avoiding problems caused by operating environments is to keep the component count and a number of pins minuscule. Stack machines, with their low system complexity and high levels of integration, do well under these conditions.

Cost

Since the cost of a chip is related to the number of transistors and to the number of pins on the chip, low complexity stack processors are basically low in cost.
Computing Performance. Computing performance in a real time embedded control environment is not simply defined. Although raw computational performance is important, there are other factors which influence the system. An additional desirable feat is a fantastic execution in programs that are filled with procedure calls reducing program memory size.

Wednesday, 12 April 2017

Other types of DAQ Hardware - Part 3

daq

Output Drive

Make certain to research how much momentum is required by whatever gadget you are endeavoring to drive with the analog yield channel. Most D/A channels are restricted to under ±5 mA or ±10 mA max. A few merchants offer higher yield streams in standard yield modules (e.g., UEI's DNA-AO-308-350 which will drive ±50 mA). For higher yield still, it is frequently conceivable to include an outer cushion intensifier. Take note of that on the off chance that you are driving more than 10 mA, you will probably need to indicate a system with sense leads in the event that you have to keep up high system exactness.

Output Range 

Another genuinely evident thought, the yield run must be coordinated to your application prerequisite. Like their analog input kin, it is feasible for a D/A channel to drive a littler range than its maximum, however, there is a decrease of powerful resolution. Most analog yield modules are intended to drive ±10 V, however a few, similar to UEI's DNA-AO-308-350, will specifically drive yields up to ±40V. Higher voltages might be obliged with outside support gadgets. Obviously, at voltages more prominent than ±40V, wellbeing turns into a critical element. Be cautious — and if all else fails, contact a specialist who will help guarantee your system is sheltered. A last note with respect to expanding the yield scope of a D/A channel is that if the gadget being driven is either disengaged from the analog yield systems, or on the off chance that it utilizes differential inputs, it might be conceivable to twofold the successful yield run by utilizing two channels that drive their yields in inverse headings.

Output Update Rate 

In spite of the fact that numerous DAQ systems "set and overlook" the analog yield, numerous more require that they react to intermittent updates. In control systems, circle security or a prerequisite for control "smoothness" will regularly direct that yields be refreshed a specific number of times each second. Additionally, applications where the D/A's give a system excitation, a specific number of updates every second might be required. Check that the system you are thinking about is fit for giving the refresh rate required by your application. It is likewise a smart thought to incorporate somewhat cushion with this spec on the off chance that you find not far off you have to "turn" the yields somewhat speedier. 2.1.9 Output Slew Rate The second some portion of the yield "speed" determination, the large number rate, decides how rapidly the yield voltage changes once the D/A converter has been ordered to another esteem. Commonly indicated in volts per microsecond, if your system requires the yields to change and balance out rapidly, you will need to check your D/A yield slew rate.

Output Glitch Energy

As the yield changes starting with one level then onto the next, a "glitch" is made. Essentially, the glitch is an overshoot that consequently vanishes by means of hose wavering. In DC applications, the glitch is from time to time tricky, yet in the event that you are hoping to make a waveform with the analog yield, the glitch can be a noteworthy issue as it might produce significant commotion on any excitation inferred. Most D/A gadgets are intended to limit glitch, and it is conceivable to basically dispense with it in the D/A system, yet it additionally for all intents and purposes ensures that the yield slew rate will be reduced.

Sunday, 9 April 2017

Common Mode and CMRR

data logging software
The distinction between the "normal voltage" of the two differential inputs and the input ground is alluded to as the signal's Common Mode. Scientifically, the Common Mode voltage is characterized as Where Vhi is the voltage of the signal associated with the V+ (or VHi) terminal and Vlow is the voltage on the V-(or Vlow) terminal. The scope of input signals where the input can disregard or "reject" the Common Mode Voltage is known as the Common Mode Range.
Basic mode range is regularly determined in volts (e.g. ±10 V). On the off chance that both inputs stay inside this range, the differential input will work appropriately. Be that as it may, if either input stretches out past the range, the differential input enhancer will soak and make a significant and frequently erratic error. To keep your signals inside the normal mode run, you should guarantee that V+ added to Vcm is not as much as the maximum furthest reaches of the regular mode range and V-subtracted from Vcm is more prominent than the lower furthest reaches of the basic mode run. The capacity of a differential input to disregard or reject this Common Mode voltage and just measure the voltage between the two inputs is alluded to as the input's

Common Mode Rejection Ratio (or CMRR)

The Common Mode Rejection Ratio of present day input intensifiers is frequently 120 dB or more noteworthy
In our case, with a CMRR of 120 dB, the proportion is one section in one million. For every volt of Common Mode on the input, there is a Common Mode Error of 1 Microvolt. As should be obvious, basic mode can be overlooked in everything except the most delicate applications.

Tuesday, 4 April 2017

Thermal Expansion/Contraction Issues

temperature data logger
A few writings regard the initial two things as a similar impact. All things considered, if the coefficients of the development of the gage and the thing under test are the same, they will contract or grow at similar rates in light of a temperature change. For this situation, an adjustment in system temperature would not bring on any adjustment in the demonstrated strain, with the exception of that in view of the gage's temperature coefficient of resistance.
It's essential to note that in a few applications, it might be alluring or even important that strain incited by temperature changes be noted. Imagine an application where a "hot segment" turbine cutting edge is being tried to guarantee appropriate freedom between the sharp edge tip and the encompassing cover. It's critical to know how much the cutting edge has stretched based upon temperature notwithstanding the radial compels of revolution. Then again, if the parameter of intrigue is truly stress or its nearby relative, constraint, any strain brought about by temperature changes would incite a genuine error in the outcome.
A strain gage used to quantify the "g" drives on a supersonic airplane wing skin may see temperatures from - 45°C to 200 °C. In the event that the g-compel data was basic to not overemphasizing the wing, you'd positively not need critical temperature-initiated error. In a more straightforward case, the heap cell used to quantify the drive set on a postal scale ought not to actuate errors basically on the grounds that the scale is alongside the window on a sunny summer day! Most applications fall into the second class, where the key estimation parameter is truly stretch, and the perfect system would be not to perceive any progressions brought on by warm extension or compression.
Like most building difficulties, there is more than one approach to skin this notorious feline.
They are:
  1. Calculate the error and dispense with it numerically, 
  2. Match the strain gage to the section, 
  3. Use an indistinguishable strain gage in another leg of the extension.

Friday, 31 March 2017

Temperature Measurements

Temperature data logger
Temperature is more likely than not the most ordinarily measured marvel in data acquisition. Regardless of whether the application is far below the ocean, on the interstate, noticeable all around, or in profound space, temperature assumes a key part in numerous systems. The most widely recognized temperature sensors are the Thermocouple, the RTD (Resistance Temperature Detector), the Thermistor, and the Semiconductor temperature sensor. Whole books have been composed with respect to temperature estimation and a top to bottom scope is past the extent of this article, yet we will offer the accompanying abridged exchange which ought to give enough data to most clients in many applications. 1.16.1 Which Sensor to Use?
Much of the time, more than one of the temperature sensor sorts would give the required outcomes. Be that as it may, considering just the accompanying variables will quite often indicate a reasonable most loved for a given application. These factors are:
• Accuracy / Sensitivity
• Temperature Measurement Range
• Cost
• System Simplicity
The Thermocouple (a.k.a. TC) is the workhorse of the temperature estimation world. It offers an exceed expectations loaned mix of sensible exactness, wide temperature measuring range, ease, and can be measured with straightforward inputs. The RTD offers extraordinary precision, repeatability, and a wide estimation run yet is genuinely costly and is to some degree complex to utilize. Curiously, thermistors run from extremely modest, low precision gadgets the distance to exceptionally costly, high exactness units. The thermistor measures temperature over a genuinely constrained range and is to some degree complex to utilize. At long last, the semiconductor sensor offers sensible precision, a restricted estimation extends, and can be observed with basic systems. Semiconductor sensors are likewise exceptionally reasonable.

Thursday, 26 January 2017

Spectra Resolution: Part 2

Spectrometer

When endeavoring to gauge the spectral resolution of a spectrometer guarantee that the deliberate flag is altogether slender to guarantee that the estimation is resolution constrained. This is regularly expert by utilizing a low weight discharge light, for example, a Hg vapor or Ar, since the linewidth of such sources is commonly much smaller than the spectral resolution of a dispersive exhibit spectrometer. In the event that smaller resolution is required, a solitary mode laser can be utilized.
After the information is gathered from the low weight light, the spectral resolution is measured at the full width half most extreme (FWHM) of the pinnacle of intrigue.
While ascertaining the spectral resolution (δλ) of a spectrometer, there are four qualities you should know: the opening width (Ws), the spectral scope of the spectrometer (Δλ), the pixel width (Wp), and the quantity of pixels in the indicator (n). It is likewise critical to recollect that spectral resolution is characterized as the FWHM. One exceptionally basic mix-up while figuring spectral resolution is to ignore the way that with a specific end goal to decide the FWHM of a pinnacle, at least three pixels is required, in this manner the spectral resolution (accepting the Ws = Wp) is equivalent to three circumstances the pixel resolution (Δλ/n). This relationship can be developed to make an esteem known as resolution variable (RF), which is dictated by the relationship between the opening width and the pixel width. As would be normal, when Ws ≈ Wp the resolution component is 3. At the point when Ws ≈ 2Wp the resolution calculate drops to 2.5, and keeps on dropping until Ws > 4Wp when the resolution figure levels out to 1.5.
For instance, if a spectrometer uses a 25µm opening, a 14µm 2048 pixel identifier and a wavelength extend from 350nm – 1050nm, the ascertained resolution will be 1.53nm.

Tuesday, 24 January 2017

Spectral Resolution: Part 1

Spectrometer
In the course of recent years, smaller than usual fiber optic spectrometers have advanced from an oddity to the spectrometer of decision for some cutting edge spectroscopists. Individuals are understanding the propelled utility and adaptability gave by their little size and similarity with a plenty of testing extras.
A standout amongst the most vital qualities of a spectrometer is the spectral (or optical) resolution. The spectral resolution of a framework decides the most extreme number of spectral pinnacles that the spectrometer can resolve. For instance, if a spectrometer with a wavelength scope of 200nm had a spectral resolution of 1nm, the framework would be fit for settling a most extreme of 200 individual wavelengths (crests) over a range.
In dispersive exhibit spectrometers, there are 3 fundamental variables that decide the spectral resolution of a spectrometer: the opening, the diffraction grinding, and the identifier. The opening decides the base picture estimate that the optical seat can shape in the locator plane. The diffraction grinding decides the aggregate wavelength scope of the spectrometer. The locator decides the most extreme number and size of prudent focuses in which the range can be digitized.
At the point when the flag linewidth is essentially more prominent than the spectral resolution, the impact can be disregarded and one can accept that the deliberate resolution is the same as the flag resolution. On the other hand, when the flag linewidth is fundamentally smaller than the spectrometer resolution, the watched range will be constrained exclusively by the spectrometer resolution.
For most applications it is protected to accept that you are working in one of these constraining cases, however for specific applications, for example, high-resolution Raman spectroscopy, this convolution can't be disregarded. For instance, if a spectrometer has a spectral resolution of ~3cm-1 and utilizations a laser with a linewidth of ~4cm-1, the watched flag will have a linewidth of ~5cm-1 since the spectral resolutions are so near each other (expecting a Gaussian appropriation).

Thursday, 1 December 2016

How it Feels to Manually Test

Automation
You’re hired! Great! You’ve got the job as a software quality assurance, just what you’ve wanted, right? Let’s take a look at your time spent at work, starting from day 1.

Day 1

You’ve happily walked into your office and there’s already a task waiting for you. Some application needs to be tested, and there are hundreds of forms, each with at least fifty-or-so fields, and even larger number of reports. That’s fine, you’re educated for all of that,  and you know what needs to be done. After an hour or so, you encounter an error. Perfect! You feel like you’ve already started contributing, you keep up with your work and find few more bugs by the end of the day.

Day 2

Like yesterday, you feel energetic, confident and ready to hunt down some errors. The bugs from yesterday were fixed, now it’s time to find if there are any more left. You pay attention to every detail and encounter more errors today, you’re getting better.

Day 3

A newer version of the app is out with minor bug fixes. You need to go all over again to check the same forms if there are any new errors. You start to feel a little bit bored, I mean, it’s the same mindless thing all over again.

Day 30

Fast forward to the end of the first month at your new job. New versions of the app come out every now and then, and you have to go through the same forms and reports all over again, countless times. You no longer feel energized and confident, you’re tired. Here and there, you begin to skip some of the steps, some bugs slip through, and you (as well as your employer) begin to question your competence. Let me stop you right there. You are not alone. Just like most of the SQA’s, you get in the phase where our “human” kicks in. You are not able to perform 100% accurately every hour, every day.
This is why we promote automated software testing, and this is just one of the reasons. ReadyDAQ’s automation technology will your and you’re employee’s precious time, money and energy. Why not invest those into something else?

Friday, 25 November 2016

How Spectrophotometer Works?

spectrometer
In order to accurately understand how does a spectrophotometer work, the first thing you need to understand is how color functions. This is a wide topic, so for this article, let’s have a fast overview. Color consists of wavelengths of light and we can split it into six categories:
•    X-rays
•    Ultraviolet
•    Visible light
•    Infrared
•    Microwaves
•    Radio waves
You can see from the list above that visible light is somewhere in between other categories, and this is what the spectrophotometer analyzes to create the desired color. The visible light spectrum is composed of red, orange, yellow, green, blue, indigo and violet. These are seven colors of which all the different colors we can see with the naked eye are created. Now don’t get confused with the absence of black and white. Black is the actually present when there is no color, and white is made up of all of these colors combined. A spectrophotometer is, in fact, a relatively simple device. The primary parts of a spectrophotometer are:
•    Source of illumination
•    Interference filters that are powered by stepper motor
•    Detector (also known as photodiode)
•    Readout device
Since it's comprised of the greater part of the hues in the noticeable range, white light is the enlightenment source utilized as a part of a spectrophotometer, as a tungsten knob or in more propelled models, a Light Emitting Diode (LED). A clasp situated on the outside of the machine holds the paint test to be coordinated, and white light is overflowed onto the example. This light is reflected off the specimen once more into the machine and onto a little wheel. The wheel is a profoundly effective shading analyzer, comprising of various obstruction channels and controlled by a stepper engine, which is known for its accuracy.
Unmistakable light is measured in nanometers, which is a modest unit of estimation in the metric framework, equivalent to one-billionth of a meter. Every channel is customized to permit a particular wavelength of light to go through it, and every wavelength is inside a specific scope of nanometers. The noticeable light range ranges from the reds at 400 nm to the blues in the 700nm territory, and the most productive wheels have channels that handle interims of 10 nm each.

Thursday, 24 November 2016

What is a Spectrophotometer?

Spectra measurement
Did you know the color can be measured? Spectrophotometers are devices made for that purpose--  to capture and assess color. As a portion of a color control program, product owners and inventors use them to stipulate and connect colors, and industrialists use them to screen color correctness through manufacture. Spectrophotometers are able to measure almost anything, from liquids and plastics, to paper, metal, and fabrics. These devices help on a mission to make sure that color stays consistent from the beginning to delivery
There are three main types of spectrophotometers, the one you should choose depends on the reason you need it for.

0º/45º (or 45º/0º)

The most widely recognized spectrophotometer, this instrument measures light reflected at a settled point to the example, generally 45˚, and can avoid gleam to most nearly recreate how the human eye sees shading. They are regularly utilized for measuring shading on smooth or matte surfaces.

Spherical

Round instruments can quantify light reflected at all points to ascertain shading estimations that nearly coordinate what a human eye would see. They are normally utilized for measuring shading that has been connected to finished surfaces, for example, materials, floor coverings and plastics, and additionally sparkling or reflect like surfaces, including metallic inks, printing overthwart, and other very lustrous surfaces.

Multi-Angle

A multi-point instrument sees the shade of an example as though it is being moved forward and backward, similarly as you would curve a specimen to see the shading on different edges. Today's multi-point instruments are utilized for uniquely covered shades and enhancement hues with added substances, for example, mica and pearlescent, for example, nail clean and car coatings.

Monday, 21 November 2016

The Basics of Testing – Part 2

Automation
We continue with educating our readers, this time with part two of the basics of testing series. Who knows, maybe this craves a path for you on a mission to become professional LabVIEW expert.
Conveying test framework programming to target machines is a basic stride in the testing procedure, however, it's regularly the most monotonous and disappointing one. Adding to that test: the plenitude of arrangement techniques accessible and the numerous contemplations test framework engineers confront.
The outline and improvement of automated test equipment (ATE) introduce a large group of difficulties, from starting arranging through equipment and programming advancement to the conclusive mix. At every phase of the procedure, changes turn out to be more troublesome and expensive to actualize.
Great arranging goes far toward moderating danger, however, it can't keep each issue, particularly in when issues emerge at definite coordination. It might be anything but difficult to state "simply alter it in programming," however equipment and programming are interwoven and issues regularly oblige redesigns to both.
Measured quality, adaptability, and versatility are basic to an effective computerized utilitarian test framework. From an equipment point of view, secluded instrumentation and exchangeable test apparatuses make this conceivable. However, how might you make the test programming similarly as versatile? Equipment abstraction layers (HALs) and measurement abstraction layers (MALs) are probably the most compelling outline designs for this errand.
An HAL is a code interface that gives application programming the capacity to communicate with instruments at a general level, instead of a gadget particular level. A MAL is a product interface that gives abnormal state activities that can be performed on an arrangement of dreamy equipment. As it were: HALs give a nonspecific interface to speak with instruments from the instrument's perspective, while MALs are a product interface that gives abnormal state activities performed on an arrangement of disconnected equipment. Printer discoursed are a magnificent ordinary utilization of an HAL/MAL.
In the test and estimation world, utilizing abstraction layers comes about as a part of a test grouping that is speedier to create, less demanding to keep up, and more versatile to new instruments and necessities. Utilizing equipment abstraction to decouple the equipment and programming gives your specialists the capacity to work in parallel.

Sunday, 13 November 2016

Tips for Improving Spectrum Measurement – Part 2

spectrometer
We've started a new series of articles, this time about spectrum measurement. The second part brings four more tips to ease your everyday tasks with spectrometers. Enjoy!

4. Locating signals can be crucial

Utilizing a directional radio wire, the signal quality capacity on analyzers can empower you to characterize a particular signal inside a band of intrigue. As the level expands, the capable of being heard tonnes can permit you to boost the line of bearing. Urban areas are a specific issue since they are loaded with reflections. An ideal approach to adapt is to continue moving and to get however many lines of bearing as could be expected under the circumstances. The more lines of bearing, the littler the measure of vulnerability.

5. GPS Receiver is not the same as GPS Mapping

Attempting to make sense of where a signal or clamor is originating from can take quite a while. Geo-referenced estimations give situational information. With a GPS trigger motor, how regularly a signal happens and where it happens can be resolved to utilize either manual or mechanized drive estimations.

6. Signal identification can often not an easy task

A signal arrangement database can be utilized to recognize signals in light of their recurrence, involved transmission capacity and range signature, as appeared in the screen catch beneath, where the range analyzer could distinguish a signal as Bluetooth channel 39. Utilize the implicit library of signals and even modify it by adding your own signals to rapidly and unquestionably recognize signals.

7. Customizing your own signal database will spare you time in future

Attempting to distinguish a particular signal in a woodland of a spectrum is tough. A signal characterization database gives signal ID and also the way to stock your range data. You can stamp and recognize your range so that obscure emitters can be effectively identified.
No, we're not done with this! The third part is coming soon, make sure to check out our blog tomorrow!

Friday, 11 November 2016

Tips for Improving Spectrum Measurement – Part 1

Spectrometer
The things are changing. Spectrum is getting more and more crowded, so detecting a single source can be challenging sometimes. It is crucial that people measuring spectrums are equipped with the best hardware as well as software solutions for spectra measurement. We have prepared 10 tips to help you improve your experience while measuring the spectrum. Here’s the first part.

1. Wireless technologies are using time varying signals that fit into a crowded spectrum

Well-known advancements like Wi-Fi and Bluetooth utilize time-changing signs in their outlines to adjust for swarmed ranges and to decrease impedance issues. Conventional test devices, for example, cleared tuned range analyzers are not improved for these new innovations. Gifted administrators and specialists are required to utilize the customary devices. Performing range mapping and pursuing down an obstruction flag regularly should be done rapidly. Additional means like going back and stack information into a guide, for example, require some serious energy and back of the general procedure.

2. Strong interferers are able to block reception and overload A/D converters, a wide dynamic range is essential

One vital necessity for range administration hardware is to have adequate element range and selectivity to abstain from sticking from interferers firmly situated to the coveted recurrence. Solid interferers can immerse simple to-computerized converters (ADCs), obstructing the gathering of a craved powerless flag. Solid interferers can likewise make intermodulation items in an analyzer that anticipate effective investigation of the craved flag. Having adequate element run permits the flag analyzer to isolate frail flags within the sight of solid signs.

3. Phase noise is always there, but excessive noise could hide signals

An analyzer's inward stage commotion can likewise be an essential trait for some signal capture applications. Indeed, even with exceptional element run, if the analyzer's neighborhood oscillator (LO) stage commotion is not adequately low, a few signs might be difficult to get. The LO in the analyzer's collector can darken the sought powerless signal. Once clouded, the demodulator can no longer observe the two signals and resolve one from the other, and the weaker signal is lost.
The last tip concludes the first part of the series. We hope to improve your experience while using spectrometers. Stay tuned, the second one is coming very soon!

Wednesday, 9 November 2016

Internet of Everything

Automation
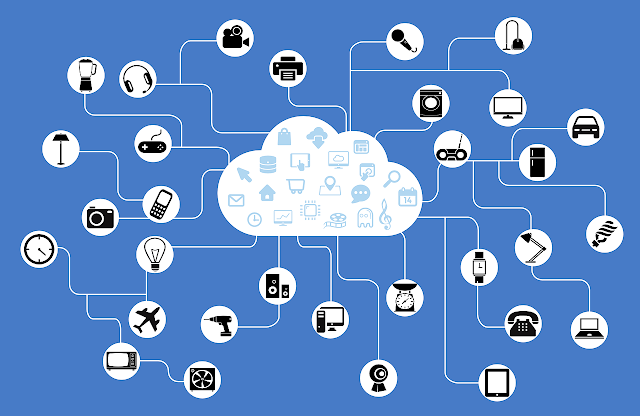
A large part of the Internet of Things are wireless transceivers combined with sensors, which can exist in almost anything physical – devices, machinery, infrastructure, even clothes. Normally, saying “wireless transceiver combined with sensors” every time would be at least awkward, so such a bulge of the IoT is called a mote. Every mote must have addressability, the state of being uniquely identifiable as well as traceable. The whole system that runs this is known as the Identity of Things (IDoT).
Our cars are already equipped with hundreds, if not thousands of sensors. Soon, they will communicate with the manufacturer for update checks, with other cars (V2V, or vehicle-to-vehicle), with the driver, of course (V2P, or vehicle-to-person), and with basically everything around them (V2I, or vehicle-to-infrastructure), which leads to the creation of IoV – Internet of Vehicles. Our health will be monitored constantly with dozens of both external and internal sensors. I’ve heard this being called BAN – Body Area Network.
Apparently, smart TVs and refrigerators are only an introduction to what’s about to come in our homes. Things like Internet-connected security systems, automation systems, robots, and many others are about to go through our door step. You’d like to watch the game or eat out? You’ll be notified which of your friends want to do the same thing, or if they already did it, so you can ask if it’s worthy.
You get the idea. In the end, we’ll have Internet of Everything (IoE), which takes us to the new level and surpasses the nature of IoT where only machines will communicate with each other. We’re also part of the equation.  Welcome to the future, stay connected.